Statistics, Data Science and Artificial Intelligence: From Data to Decisions
In today’s digital world, data has become one of the most important resources for understanding society, science, business, health, finance, and technology. As an academic in statistics and data science, I have presented a few times across a few universities in Indonesia about “Big Data, Statistics and Data Science — and now Artificial Intelligence” to explain how statistics, data science, machine learning, and artificial intelligence are connected, and why these fields are increasingly important in education, research, and professional practice. I am pleased to share the presentation below.
Understanding Data and Big Data
Data begins with the collection of information from cases. A case may be a person, company, animal, plant, object, or any unit of interest. Each case has variables, such as age, height, blood pressure, ethnicity, language, leaf length, or income. These variables take different values across different cases, and the distribution of a variable tells us how often those values occur.
In recent years, the scale of data has changed dramatically. We now live in an era of big data, where massive amounts of observational data are produced continuously from websites, mobile devices, sensors, financial transactions, health records, social media, images, and online activities. Big data is often described through the 5Vs: velocity, variety, volume, veracity, and value. These dimensions remind us that big data is not only about size, but also about speed, diversity, trustworthiness, and usefulness.
This video ”Did You Know 2026” By Jose Esteves
Statistics: Making Sense of Variation and Uncertainty
Statistics provides the foundation for learning from data. It includes methods for data collection, presentation, modelling, analysis, and decision-making. Most importantly, statistics takes account of the variation and uncertainty that occur in the real world.
A key distinction in statistics and data science is between experimental and observational studies. In experimental studies, researchers randomly allocate treatments to different groups to understand their effects. Randomized clinical trials, for example, are considered a gold standard because they can help establish causality. In observational studies, however, data are passively observed rather than actively controlled. These latter studies are common in data science and are useful for prediction, but they make causal conclusions more difficult.
The Emergence of Data Science
Data science has grown because society now has the ability to measure, store, and analyze enormous amounts of data. Data are collected from online tracking, finance, medical records, pharmaceuticals, bioinformatics, social welfare, retail, learning management systems, Wi-Fi usage, and many other sources. The main challenge is not merely collecting data, but extracting useful information from it.
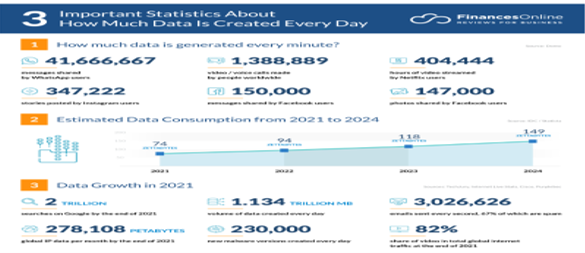
Important Statistics: Finances Online https://financesonline.com/how-much-data-is-created-every-day/
Unlike traditional statistics, which often works with smaller structured datasets, data science frequently handles newer forms of data, including text, time-stamped records, geolocation data, network data, sensor data, and images. This reflects the process of datafication, where aspects of the world that were previously difficult to quantify are transformed into data.
Data science is not just another name for statistics. It sits at the intersection of statistics, computer science, visualization, and communication. A data scientist must be able to obtain data, clean and visualize it, apply statistical modelling or machine learning, and communicate results effectively.
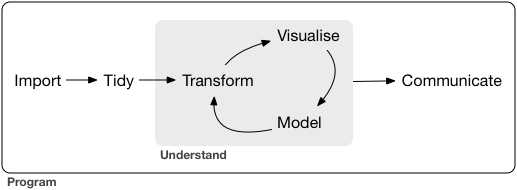
What Data Scientists Do
The role of a data scientist can vary widely. Some data scientists focus on business value and organizational decision-making. Others are “data creatives” who combine data extraction, integration, modelling, visualization, and scalable analysis. Data developers focus on managing, storing, and processing data, while data researchers often come from academic backgrounds and bring deep knowledge of statistics and machine learning.
What unites these roles is the ability to turn raw data into insight. A data scientist must understand not only technical tools, but also context, communication, and ethics. The presentation emphasizes that, while data can become the building block of useful products such as recommendation systems, we must not ignore the ethical implications of how data are collected and used.
Statistical Modelling and Machine Learning
One of the major goals of data science is prediction. Statistical models and machine learning algorithms can be used to predict health outcomes, credit risk, tropical cyclone patterns, house prices, student withdrawal, stock market behaviour, and many other phenomena.
Machine learning can be divided into two broad categories: supervised learning and unsupervised learning. In supervised learning, a model predicts a specific response variable using explanatory variables. Examples include regression, classification trees, neural networks, and other predictive models. In unsupervised learning, there is no clear response variable; instead, the goal is to discover patterns or groupings in the data. Examples include clustering and principal component analysis.
The presentation introduces many common modelling techniques, including Bayesian methods, clustering, association rule mining, artificial neural networks, deep learning, dimensionality reduction, ensemble methods, text mining, regression, k-nearest neighbours, regularization methods such as LASSO and ridge regression, and decision trees such as CART and random forests.
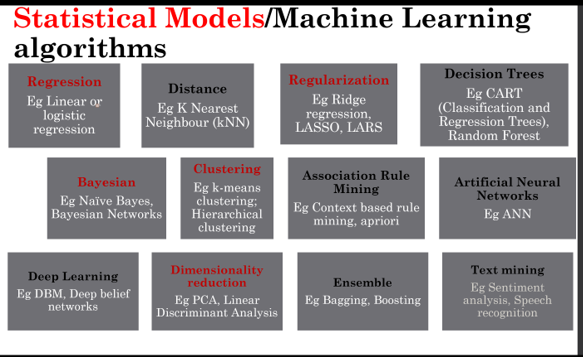
Statistical models in red, ML in black
Tools for Data Science: R, RStudio and R Markdown
The presentation highlights R as a central tool in data science, alongside Python. R is free, open-source, multi-platform, and widely used for statistical computing and data analysis. It has many packages and online learning resources, making it suitable for both beginners and advanced analysts.
RStudio is introduced as a powerful integrated development environment for R, while knitr and R Markdown support reproducible analysis. These tools allow analysts to combine code, explanation, output, tables, and graphics in one document, producing reports in formats such as HTML, PDF, and Microsoft Word. Reproducibility is a major advantage because it allows others to understand and verify how results were produced.
The presentation also discusses R packages for visualization and modelling, including tools for interactive graphs, dashboards, Shiny applications, flexdashboard, and the caret package for predictive modelling. The caret package helps streamline data splitting, preprocessing, feature selection, model tuning, resampling, and variable importance estimation.
Case Study: USA Arrest Data
A practical example in the presentation uses the USA Arrests dataset, which contains violent crime statistics for 50 US states in 1973. The variables include murder, assault, rape, and percentage of the population living in urban areas.
The presentation demonstrates Principal Component Analysis, or PCA, which reduces a set of variables into a smaller number of components while preserving much of the original variation. PCA is useful for data reduction and interpretation. In the USA Arrests example, the first principal component represents an overall rate of serious crimes, while the second component is strongly related to the level of urbanization.
The same dataset is also used to demonstrate k-means clustering and hierarchical clustering. These unsupervised learning methods group states according to similarities in crime and urban population patterns. Such techniques help analysts identify hidden structures in data without needing a predefined outcome variable.
Case Study: New York Stock Exchange Data
A second case study focuses on New York Stock Exchange time series data from 1962 to 1986. The variables include log trading volume, Dow Jones return, and log volatility. The goal is to predict tomorrow’s log trading volume using previous values of trading volume, return, and volatility.
This example illustrates the use of forecasting models, including recurrent neural networks and autoregressive models. It shows that predictive performance can be compared using measures such as , and that additional information such as the day of the week may improve model performance.
Artificial Intelligence and the New Data Era
The presentation ends by connecting statistics and data science to Artificial Intelligence. AI is described as a branch of computer science that aims to create intelligent machines capable of mimicking aspects of human performance, such as learning, understanding complex ideas, drawing conclusions, and engaging in dialogue.
Machine learning is presented as a branch of AI that allows machines to learn from data. Deep learning is a further branch of machine learning that uses neural networks to learn data representations. The presentation also introduces transformers, which are neural networks designed to learn context and meaning by tracking relationships in sequential data, such as words in a sentence.
Modern AI tools such as ChatGPT, Gemini, and deepfake technologies demonstrate both the power and risk of AI. Deepfakes, for example, use AI to replace the likeness of one person with another in video or audio, making it increasingly difficult to distinguish real from artificial media. Gemini is introduced as a multimodal AI model capable of handling text, images, code, speech, and other forms of data.
Conclusion
Statistics, data science, and artificial intelligence are deeply connected. Statistics teaches us how to reason under uncertainty. Data science expands this foundation by combining statistical thinking with computing, visualization, communication, and large-scale data processing. Artificial intelligence builds further on these ideas by enabling systems to learn, predict, generate, and interact in increasingly sophisticated ways.
The main message of the presentation is clear: data alone is not enough. To create value, we must collect data carefully, analyze it responsibly, model it appropriately, visualize it clearly, communicate it effectively, and consider its ethical implications. In the age of big data and AI, the most valuable skill is not simply using advanced tools, but understanding how to transform data into reliable knowledge and responsible decisions.
